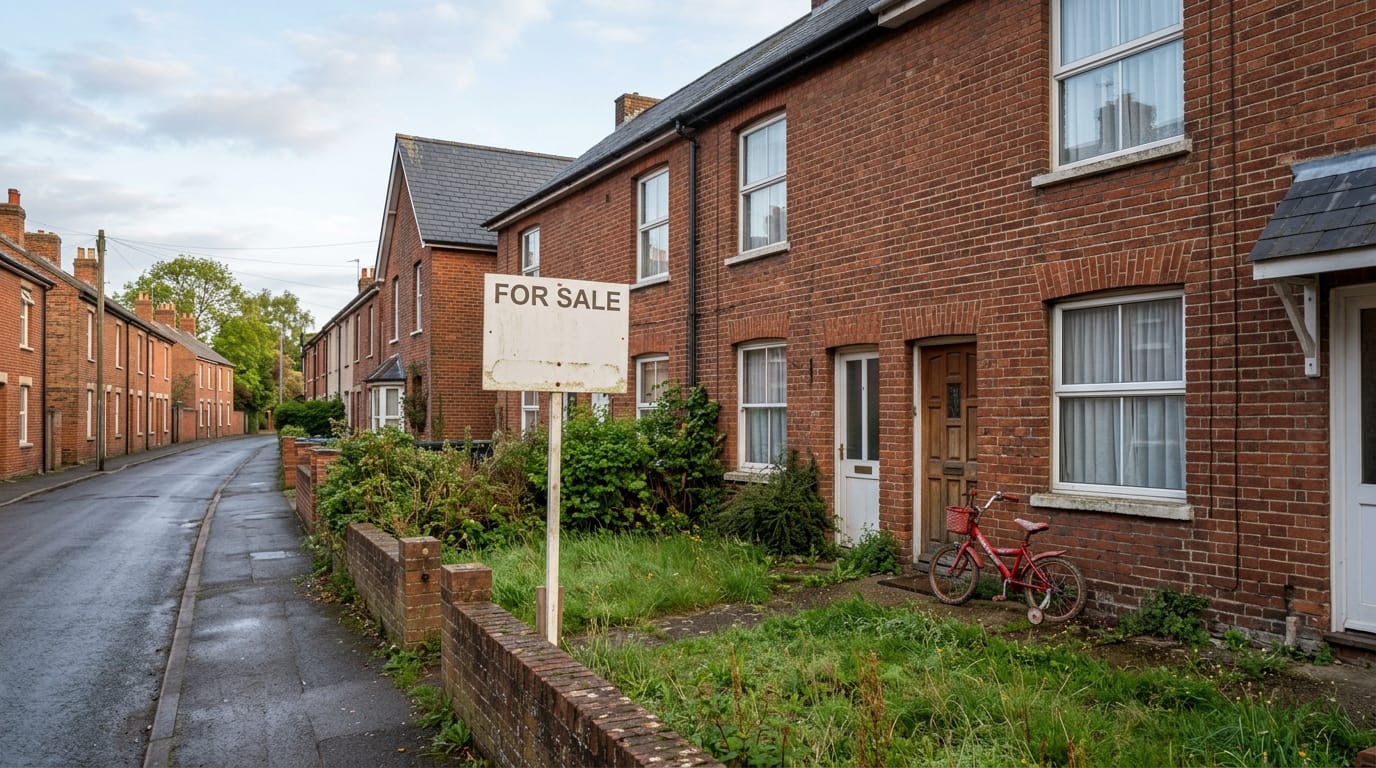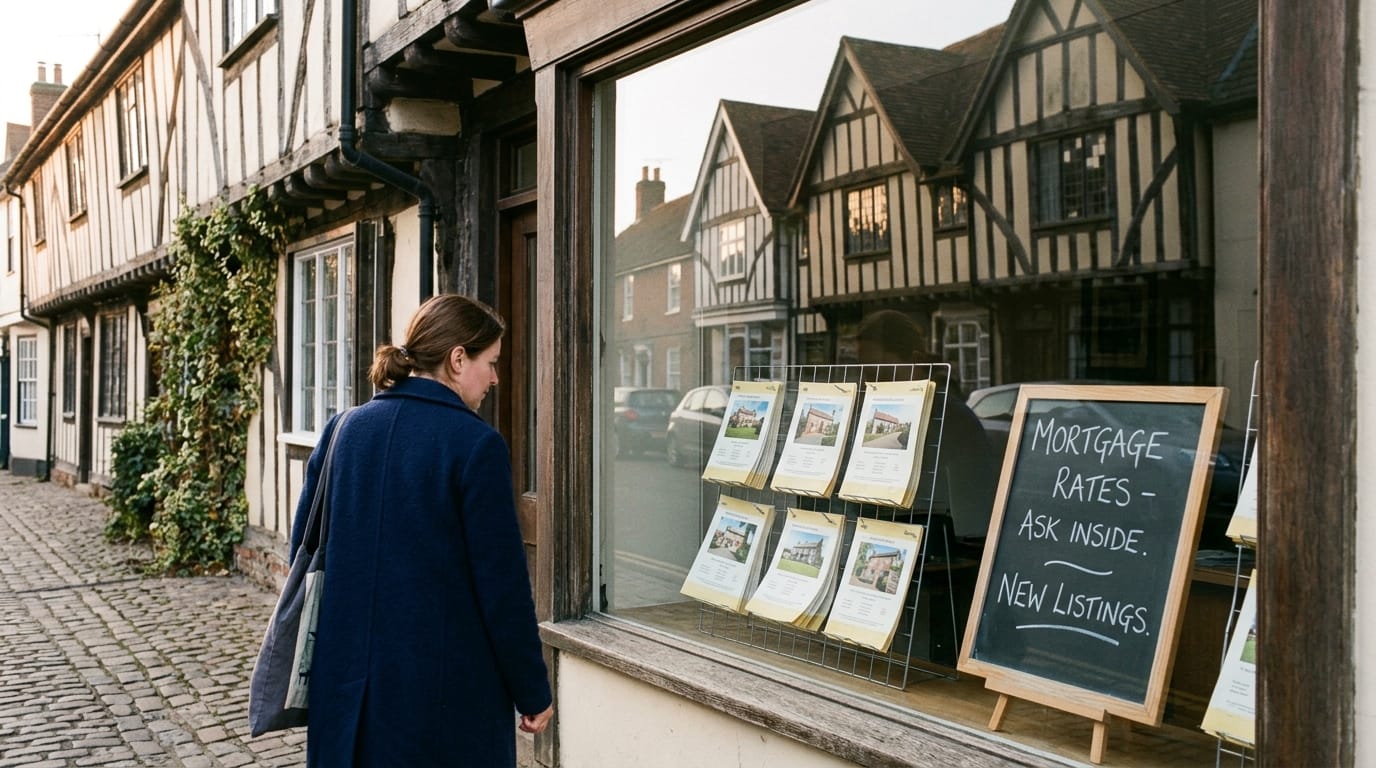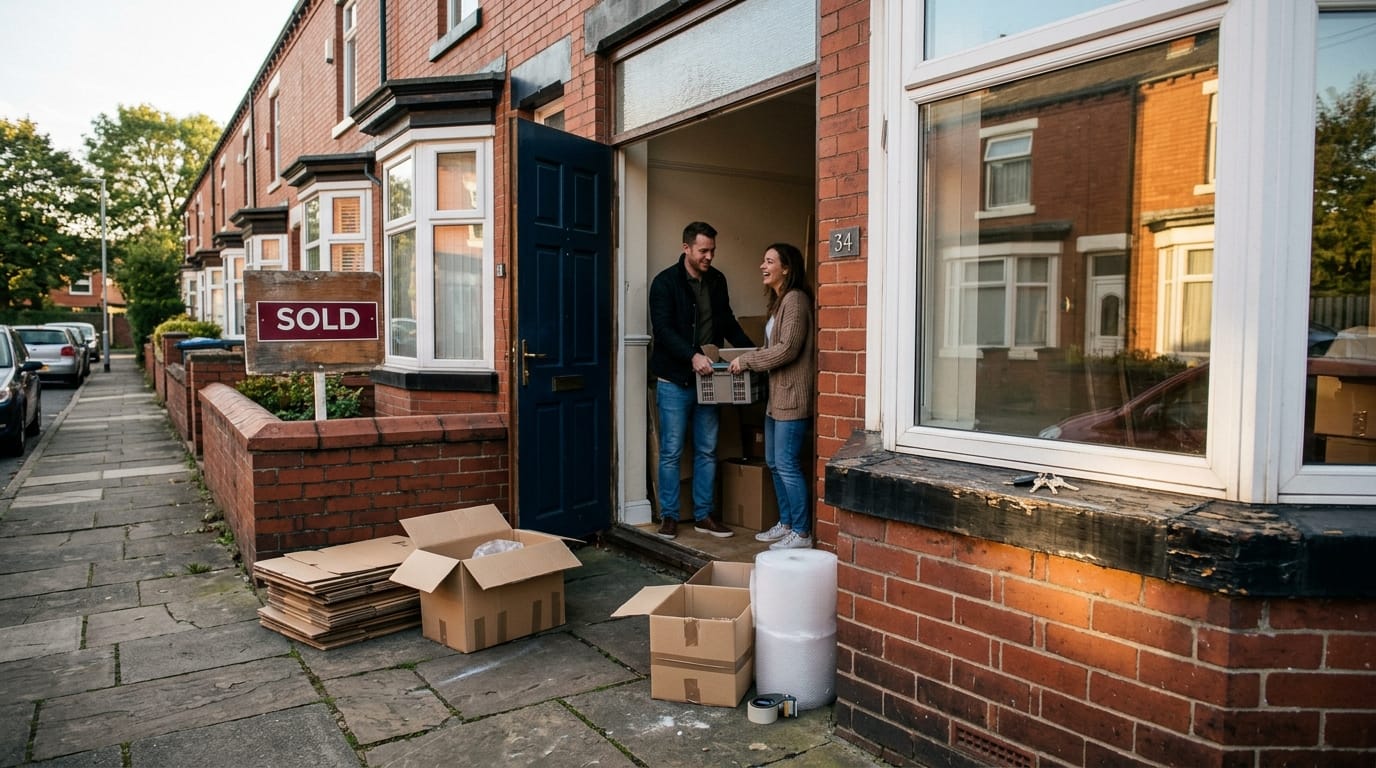
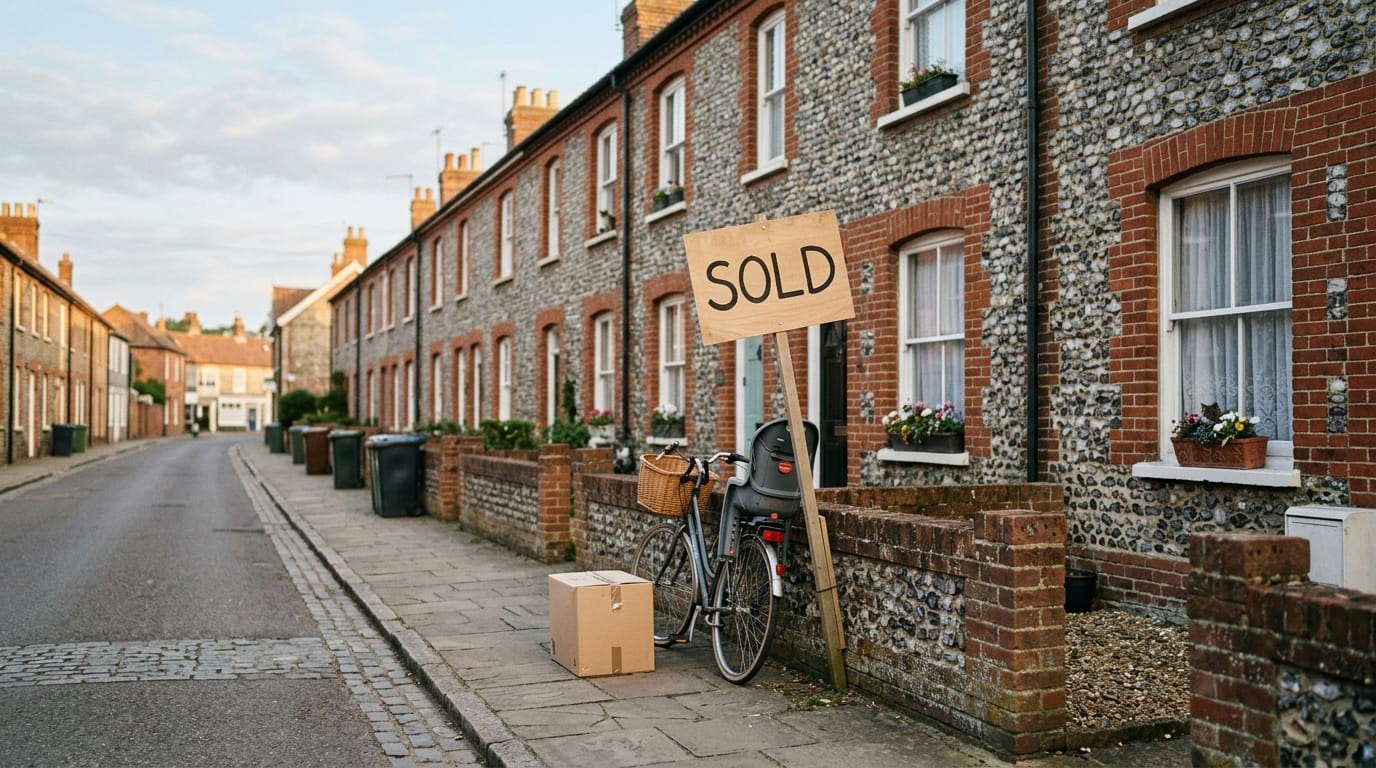

Selling your home has become, statistically speaking, a coin flip. Fresh data from one of the UK’s largest estate agency networks reveals that just 50.9% of homes leaving agents’ books in June 2026 went on to exchange and complete. The remaining 49.1% were withdrawn unsold.
For every seller who moved last month, another pulled their property off the market or watched it sit until confidence drained away. With 760,000 homes listed for sale across the UK as of 1 July, the implications for anyone considering a move this summer are significant.
Weekly market tracker data, compiled from across the UK’s residential market, counted 34,700 new listings in the week ending 12 July. Some 23,500 homes sold subject to contract in the same period, slightly below the 2026 weekly average of 24,700 and well beneath the 10-year week 27 average of 25,400.
Year to date, 667,000 homes have been sold subject to contract. That’s 6.9% fewer than the 717,000 agreed at the same point in 2025. Yet the figure sits marginally ahead of 2024 and 10.7% above 2023. Sales aren’t collapsing. They’re recalibrating to a level that’s still historically healthy, if less forgiving of mistakes.
Net sales, stripping out transactions that fell through, total 519,000 for the year so far: 5.3% below 2025 but comfortably ahead of both 2024 and 2023.
The data points to one persistent issue. In June, 14.3% of homes on the market had undergone at least one price reduction, up from 13.4% in May and well above the six-year long-term average of 10.7%. The 2026 year-to-date average sits at 12.9%.
“The biggest problem is not a lack of buyers,” one senior franchise director noted in the accompanying market analysis. “It is the continued overvaluing of homes by agents who are more frightened of losing the instruction than they are of telling the vendor the truth.”
The gap between what sellers ask and what buyers actually pay tells its own story. Average asking prices for new listings stand at roughly £427,000, while properties that go under offer carry an average asking price of £373,000. That 14.4% gap is narrower than the 10-year average of 16% to 17%, but it still represents a meaningful disconnect for sellers who find themselves on the wrong side of it.
One figure stands out from the noise. Of every home that has sold subject to contract so far in 2026, 80.1% did so without a single price reduction. Properties priced accurately from the outset create competition, generate momentum and progress smoothly to exchange.
Those that aren’t priced right face a different trajectory entirely. The sell-through rate, measuring the proportion of listed stock that goes under offer each month, dropped to 13.8% in June from 14.6% in May. Before Covid, the average was 15.5%.
Fall-through rates tell a more encouraging story. At 24.2%, they sit just below the decade average of 24.5%. The monthly rate of 5.07% in June was better than both the 2025 average of 5.3% and the 10-year average of 5.8%. Once buyer and seller agree on a realistic price, the transaction is more likely than ever to reach completion. The difficulty lies in reaching that agreement.
Stock levels give buyers significant leverage. The 760,000 homes available on 1 July almost exactly match the 763,000 on the market twelve months earlier, while the sales pipeline has thinned slightly from 493,000 to 475,000.
More choice and fewer agreed sales mean buyers can take their time. They’re comparing, negotiating and walking away from properties they consider overpriced. For sellers who ignore this dynamic, the risk isn’t just a slow sale. It’s no sale at all.
Norfolk’s property market has its own rhythms, shaped by seasonal demand, coastal premiums and the county’s distinctive mix of market towns and rural villages. But these national trends don’t stop at the county boundary.
Markets in Norwich and King’s Lynn behave very differently from Burnham Market or Holt, and within each location there are streets and property types performing better than others. Getting the price right requires understanding the micro-market, not just the national averages.
The Ivybridge Collection’s property market reports, covering 324 locations across the region, provide a detailed view of where individual towns sit within these broader patterns.
Beneath the cautionary data, there’s a positive story for homeowners. Agreed sale prices, measured per square foot, averaged £350.22 in June 2026. That represents a 1.94% increase on twelve months ago and a 12.3% gain over five years. House prices haven’t stalled. They’ve simply become less tolerant of properties testing the market at aspirational levels.
The rental market tells a complementary story. Average rents reached £1,862 per month in the most recent weekly data, with the 2026 year-to-date average at £1,758 compared to £1,791 in June 2025. Property remains a strong asset class, whether for owner-occupiers or landlords, provided expectations align with the evidence.
The mid-summer 2026 market isn’t broken. Sales volumes exceed both 2023 and 2024. Prices are rising, if modestly. Fall-throughs aren’t climbing. The fundamentals remain sound.
But the margin for error has vanished. When half of all listings fail to complete, the difference between a successful sale and a wasted six months comes down to a single decision made on the first day of marketing: getting the price right.