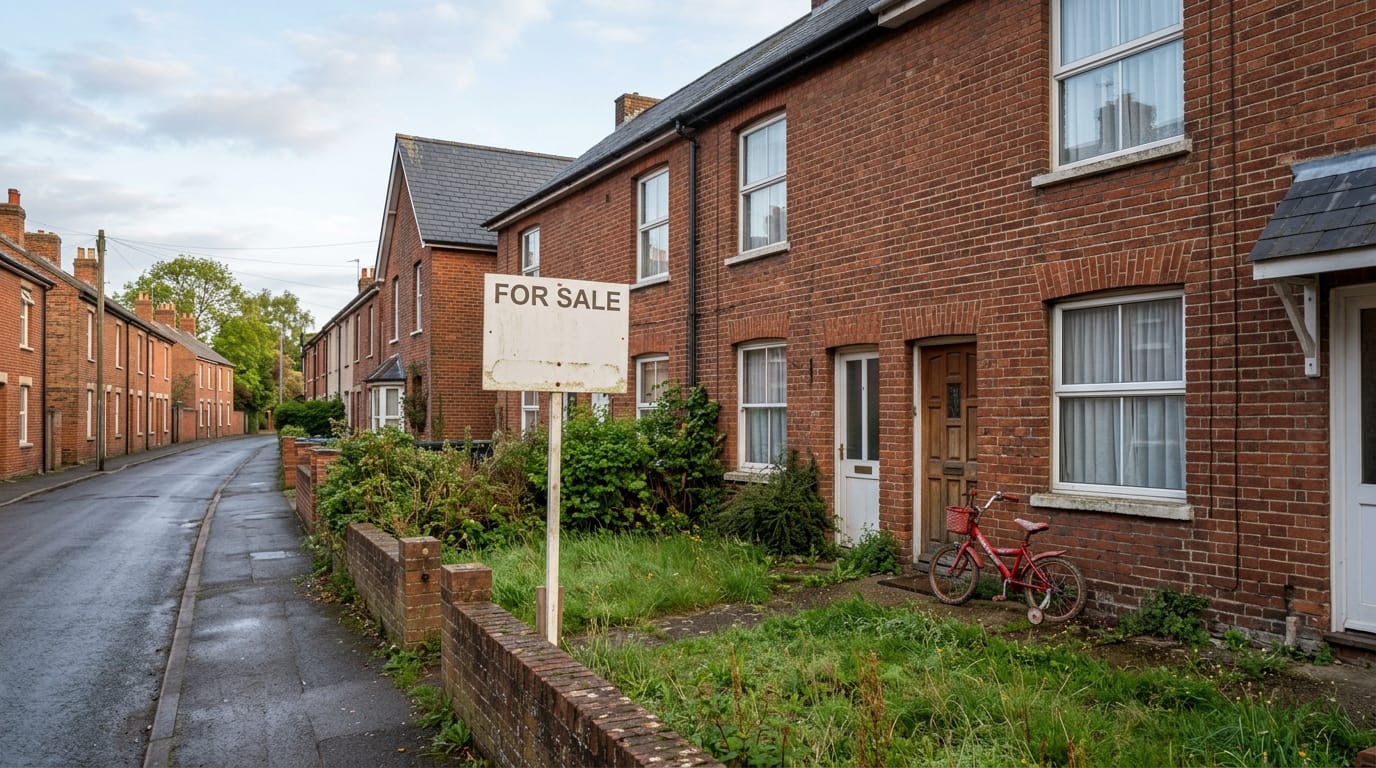

House prices rose by just 0.1% in July, according to Nationwide, taking the average UK home to £277,542 and slowing annual growth to 1.8% from 2.2% in June. In cash terms the typical property gained £58 over the month. That is what passes for movement in what should be the busiest buying season of the year.
The figure is still below May’s reading, when the average crept above £278,000. Prices, in other words, have gone sideways for a quarter.
Robert Gardner, Nationwide’s chief economist, put the blame squarely on the wider backdrop. “Geopolitical tensions remain high, with the conflict between Iran and the US again exerting upward pressure on energy prices and market interest rates in recent weeks,” he said. “Financial market expectations for the future path of Bank rate have been volatile, reflecting shifting views about the inflationary implications of events at home and abroad.”
That volatility is the real story. Buyers can plan around a known rate. They struggle to plan around a rate that markets reprice every fortnight. The Bank of England held Bank Rate at 3.75% on Thursday while warning that further escalation could push inflation above 4% next year, which leaves borrowers reading the same tea leaves as the traders.
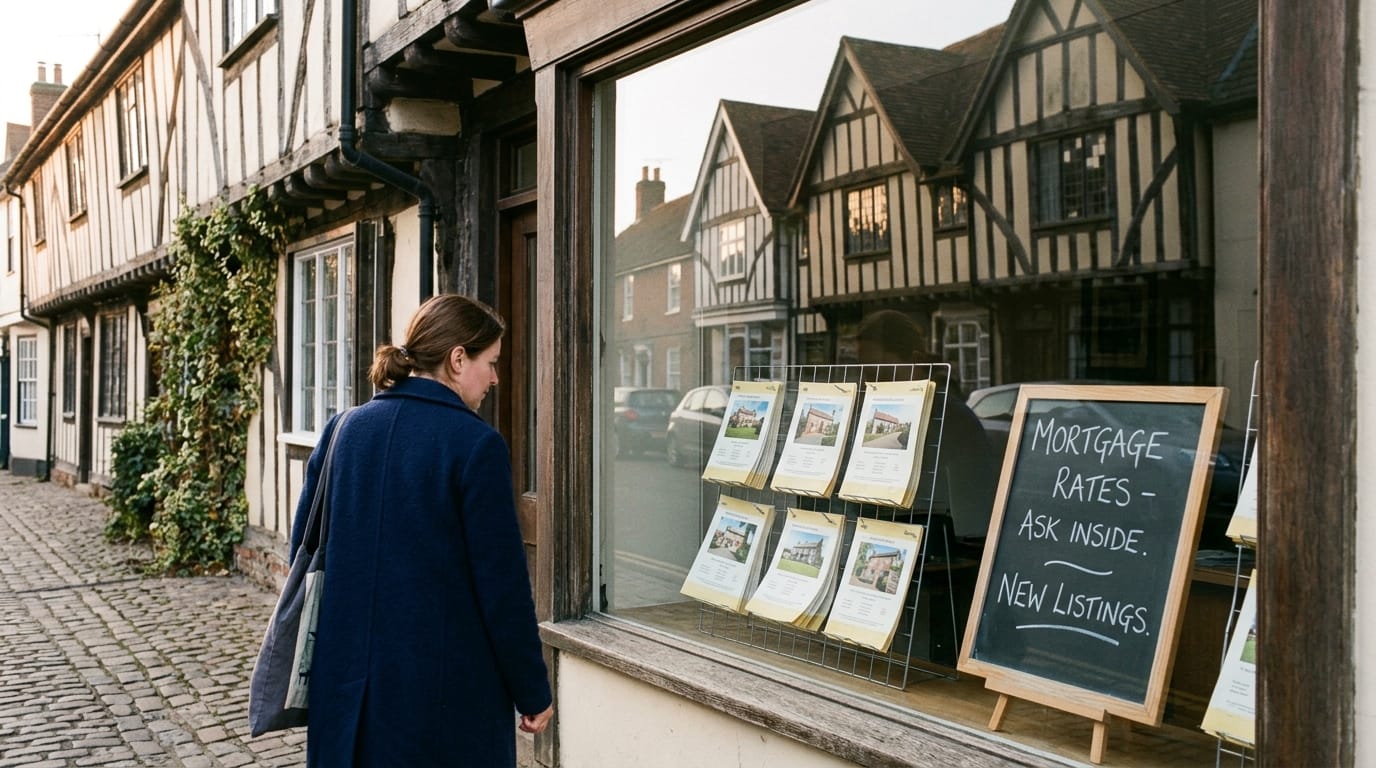
Mortgage pricing has already moved. The average rate began the year near 4% and now sits around 4.75%, adding more than £1,500 a year to the cost of buying an average-priced home on borrowed money.
Alongside rates sits the Budget. Speculation about property taxation has run hard since Andy Burnham became Prime Minister, and this week’s decision to rule out replacing stamp duty with a land value tax settled one question while leaving several open. A steeper mansion tax has been rumoured. So has a levy to replace council tax. The Prime Minister has repeated his predecessor’s line about difficult decisions ahead.
One head of UK residential research described the annual game of “guess the tax rise” as far from over for the property market. He is right, and the effect is measurable: at the upper end particularly, households considering a discretionary move are simply waiting for the autumn to arrive before committing.
Taylor Wimpey reported first-half results the same morning and described conditions as challenging, citing weaker buyer demand alongside rising build costs. It now expects to complete between 10,600 and 10,800 homes this year, the lower end of the range it guided to in March. Shares fell almost 6% in early trading.
New-build guidance is a useful leading indicator. Volume builders commit capital months ahead of completions, so when they trim, they are telling you what their sales offices saw in spring.
A 0.1% national figure is an average of very different markets, and it flatters some places while punishing others. The pressure described by buying agents, a surfeit of stock and buyers holding a strong negotiating hand, is most acute in London and the South East. Norfolk and Suffolk behave differently, because so much of the demand here is lifestyle-led rather than commute-led, and because the supply of genuinely good period and coastal houses is finite in a way that supply in the Home Counties is not.
That doesn’t make the region immune. Anything competing directly with new-build stock, or dependent on a mortgage-stretched local buyer, is feeling the same drag as the national numbers suggest. The divergence is between properties with a defensible reason to exist and everything else.
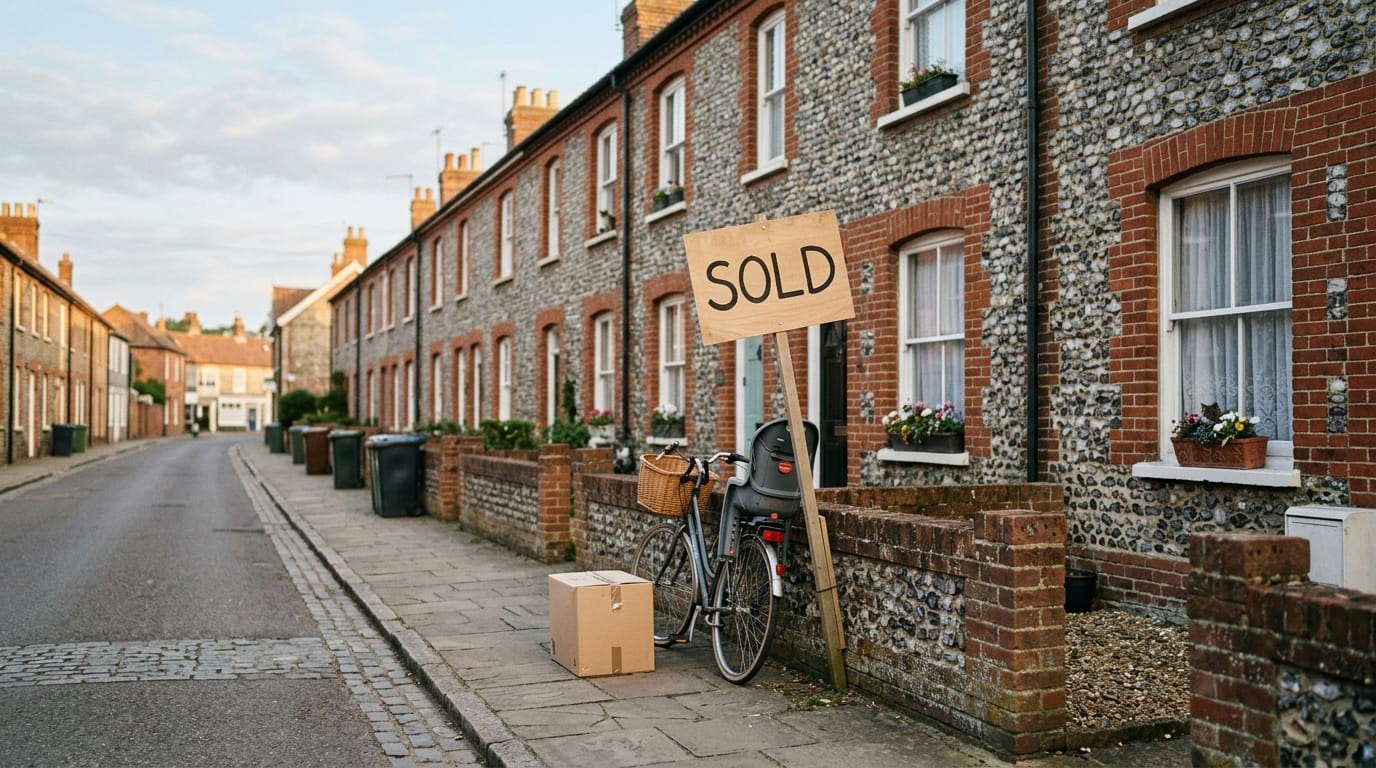
In practice, we’re seeing the market split by price band and by street rather than by county. A well-presented house in Holt or Burnham Market with no obvious compromise still attracts competing interest. The same house half a mile away, backing onto a busier road, now needs to be priced with real honesty from day one. Our 324 local property market reports exist precisely because a national index cannot tell you which of those two positions you are in.
A sales head at a London agency made the point neatly this week: prices are flat, sensible offers are being accepted, there are more sellers than buyers, but sellers aren’t panicking. Asking prices are coming down, and much of that is initial overpricing meeting the time it takes to find the market level.
That distinction matters enormously to anyone reading headlines about falling asking prices. Reduced asking prices and falling values are not the same thing. A house launched 10% above the evidence and reduced back to the evidence hasn’t lost value. It has lost weeks, and weeks are the expensive part.
Buried in the same release was a statistic that explains more about Norfolk and Suffolk than any monthly index. English Housing Survey data shows outright owners have lived in their current home for nearly 24 years on average, and around a third of them have been in the same property for 30 years or more. Mortgaged owners average almost nine years. Private renters, four and a half.
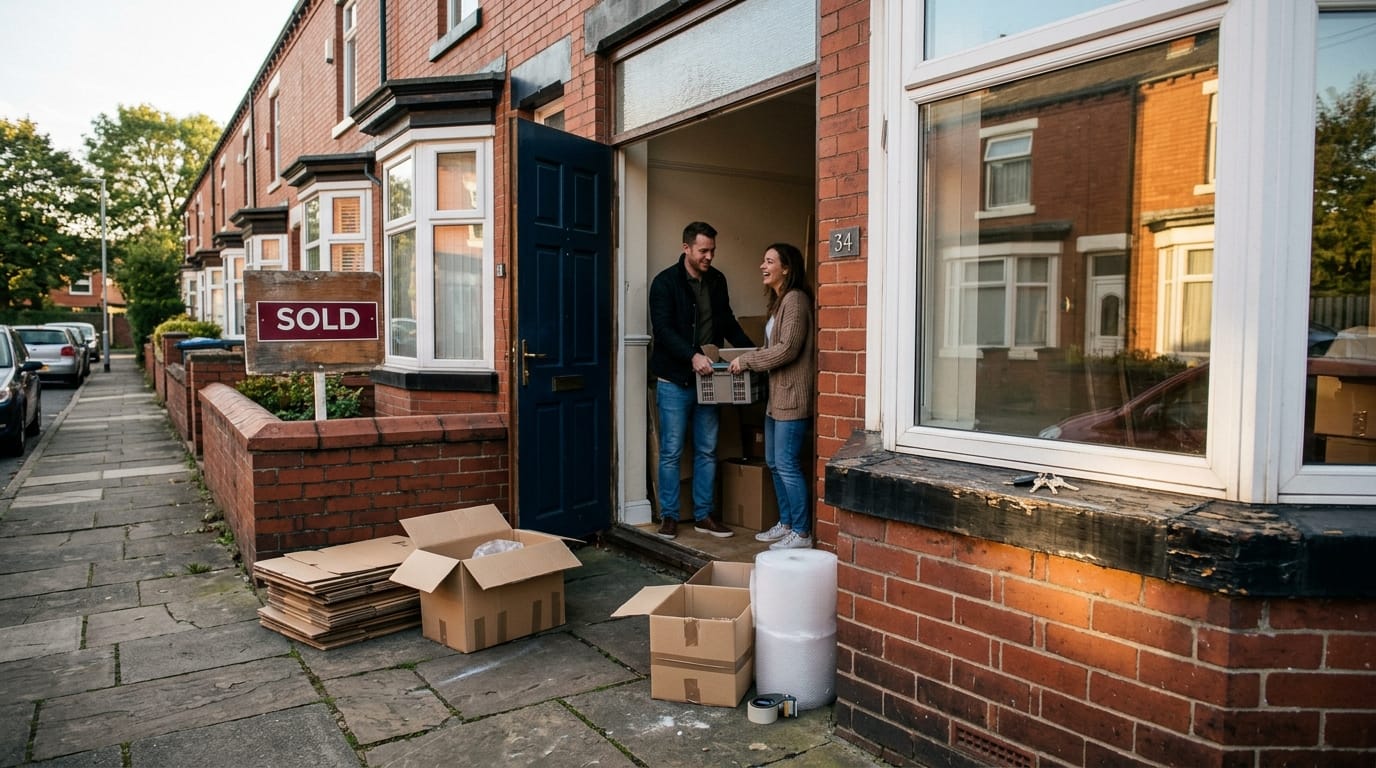
In a region with a high proportion of older, unmortgaged homeowners, that is the supply picture. The best houses come to market when life events dictate, not when indices improve. Gardner also noted the churn between tenures: nearly 200,000 households moved from private renting into ownership in 2024-25, with around 100,000 travelling the other way.
Lenders reported a burst of activity when the Iran conflict began and borrowers rushed to lock in, followed by a return to normal application levels. One bank chief executive expects more clarity as the summer gives way to September. That is the pivot point: an autumn Budget with the property tax question answered, and a rate path that either steadies or turns.
If borrowing costs start falling again, the demand bottled up since spring has somewhere to go, and the constraint in this region will be quality of stock rather than appetite. For owners of the right houses, the sensible use of a flat summer is preparation. Get the survey issues addressed, the paperwork assembled and the pricing evidence current, so that when confidence returns you are the house that is ready and not the house that needs a fortnight.